Company management is often challenged to understand sales performance.
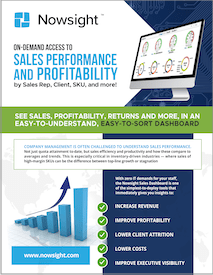
On-Demand Access to Performance and Profitability — by Sales Rep, Client, SKU, and more!
See sales, profitability, returns and more, in an easy-to-understand, easy-to-sort dashboard.
Not just quota attainment to-date, but sales efficiency and productivity, and how these compare to averages and trends. This is especially critical in inventory-driven industries — where sales of high-margin SKUs can be the difference between top-line growth or stagnation.
With zero IT demands for your staff, the Nowsight Sales Dashboard is one of the simplest-to-deploy tools that immediately gives you insights to:
-
Increase revenue
-
Improve profitability
-
Lower client attrition
-
Lower costs
-
Improve executive visibility
Because Nowsight combines the advanced BI with the power of AI machine learning—you don’t get just “this happened overnight” kind of insights, you get specific information to help improve close rates, spot trends and predict personal/divisional/business-wide performance.
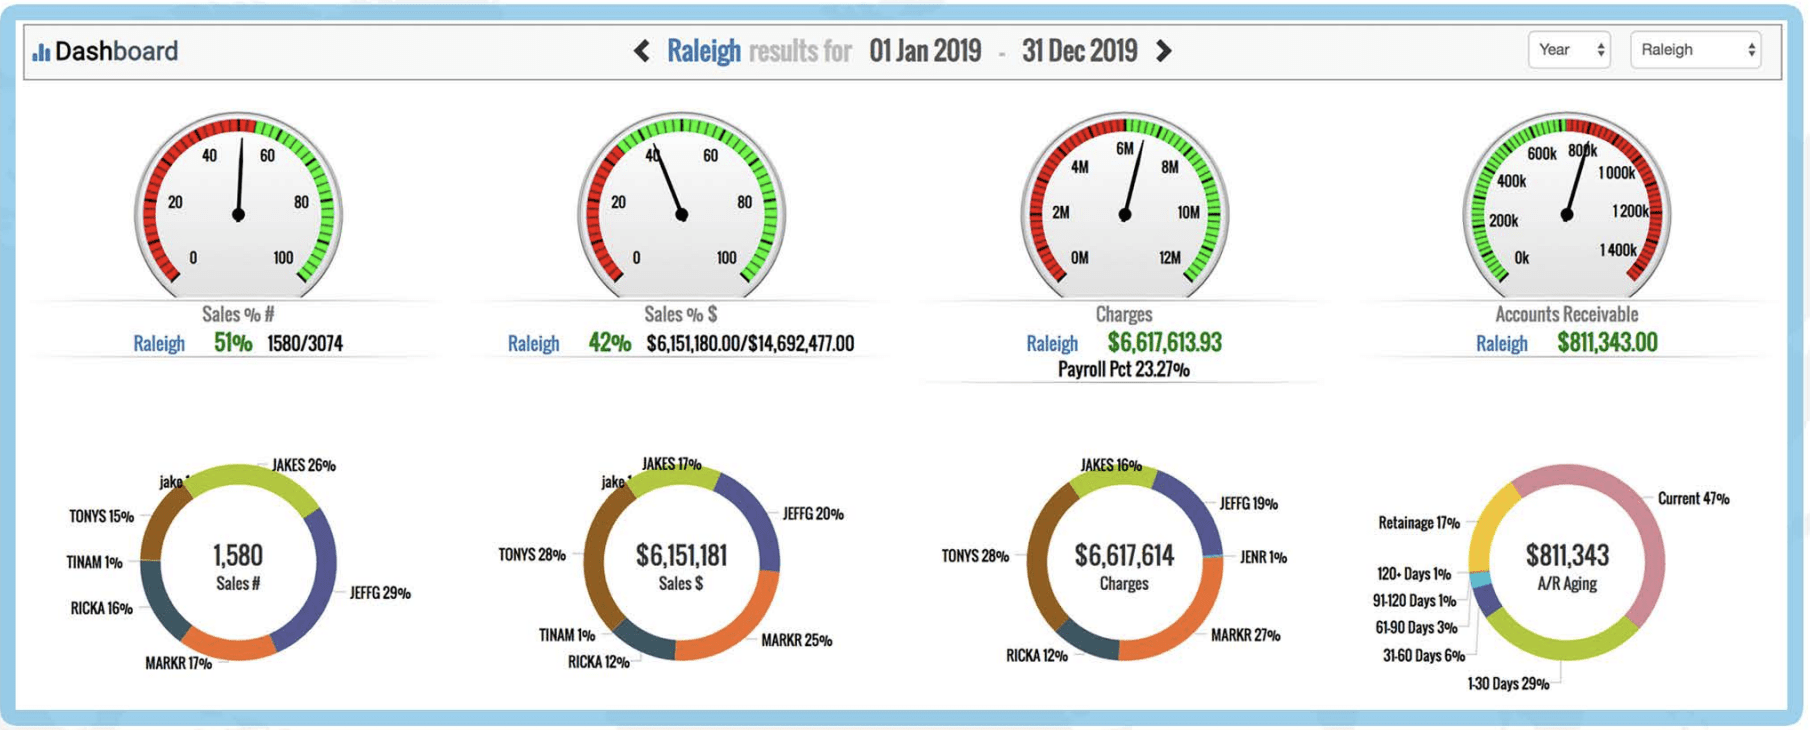
The Nowsight Sales Dashboard gathers and analyzes your data sources to generate leaderboards, progress toward goals and personalized dashboards (by role, level or individual).
Simply put, this will help lead your business to unprecedented levels of performance.
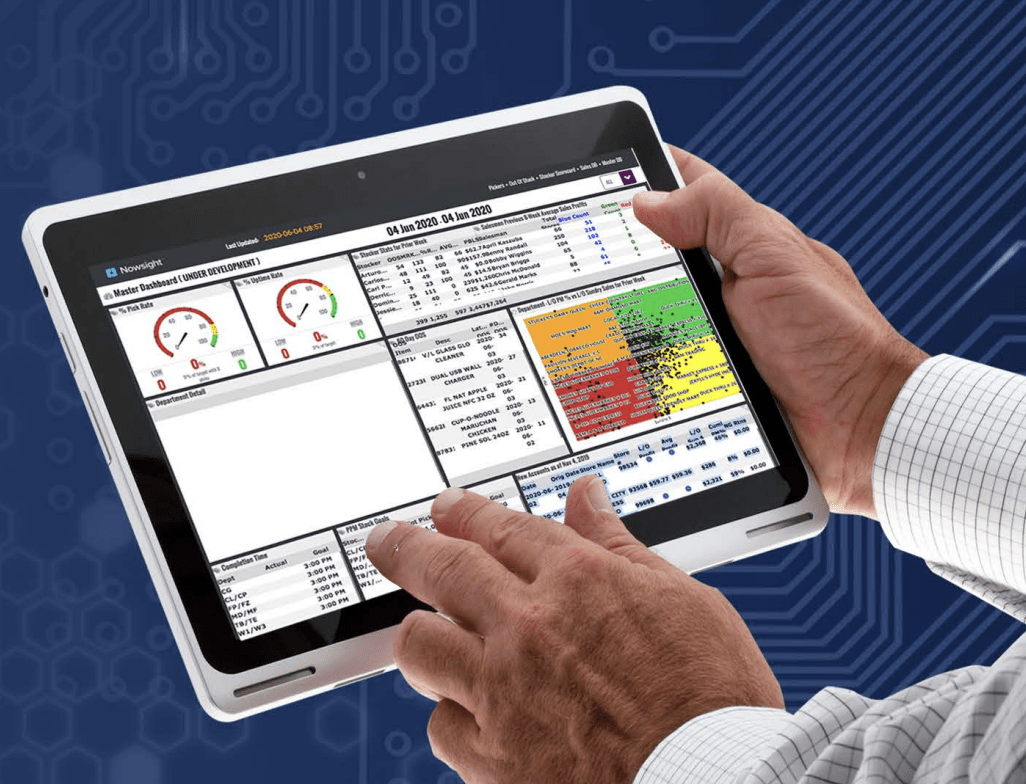
Management and Sales now have the data they need on-demand and in an easy-to-understand format. No reports to run, spreadsheets, or data crunching, because Nowsight is a real-time, up-to-the-minute view directly into your business from any computer, phone or tablet.
Your business runs in real-time, so should your reporting.
Week-end or month-end reports on sales figures are out-of-date and obsolete by the time they are created. And even more critical, management has lost crucial time to address issues, causing problems to compound and missing opportunities for growth.
Every morning your leadership team, managers and sales reps get an email that shows their performance, distance from goals and comparison to peers. You can customize the content of this email to ensure everyone understands where you are hitting your goals, and where you need to improve.
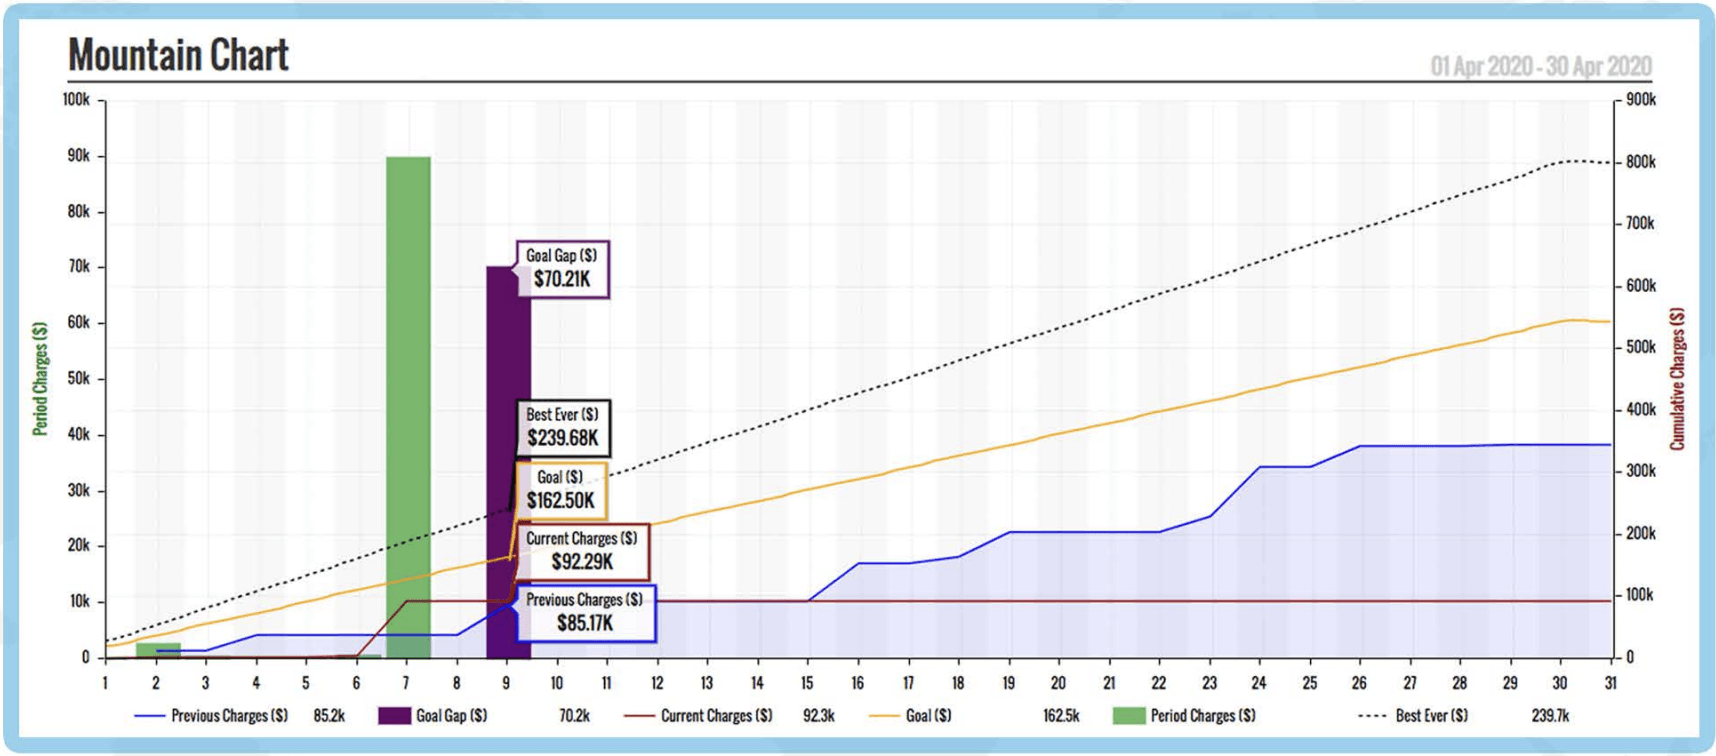
In a single chart, you can see powerful business insights. The blue line shows previous charges while the red line shows current charges. The yellow line is the goal and the dotted black line is best-ever performance. The bars show current charges in green and the gap to goal in purple. This can be viewed by location, branch or aggregate and by month, quarter, or year.
Real-time alerts also give management unprecedented insight into business performance momentum, with time to react, adjust, and improve the bottom line. Emails and text alerts are sent directly to management and/or sales reps when goals are hit (or missed), exceptions are identified, or other thresholds are met.
More than a sales report — this is actionable Business Intelligence.
Traditional sales and order reports can’t do the complex calculations that the Nowsight Sales Dashboard delivers. With a simple click, data is analyzed and presented by sales representative, client/account, region, SKU, returns (in dollars and as a percent of order), and more.
Quickly see:
-
Profit/loss by sales rep, store/client or region
-
Week/week or month/month trends in profitability
-
Sales and profitability of specific SKUs or orders—and how that compares to historical averages and targets
-
Returns and return percentage relative to dollars sold
-
Performance against your custom KPIs
Combining dashboards with real-time alerting is what takes Nowsight’s solutions to the next level.
- Do you want to see if one category of goods is at least 25% of each order? Done.
- What if a client hits the threshold for a performance bonus? Done.
The Nowsight leadership team helps you define exactly what the most high-impact measurements are, and then puts them right at your fingertips.
Alerts can be sent via text or email and configured to be triggered by performance thresholds being met (or missed), inventory levels hitting pre-determined levels, exception identification — virtually any data point can be used for real-time alerting. Imagine the power of managers, shift leaders and management knowing what is happening in real-time.
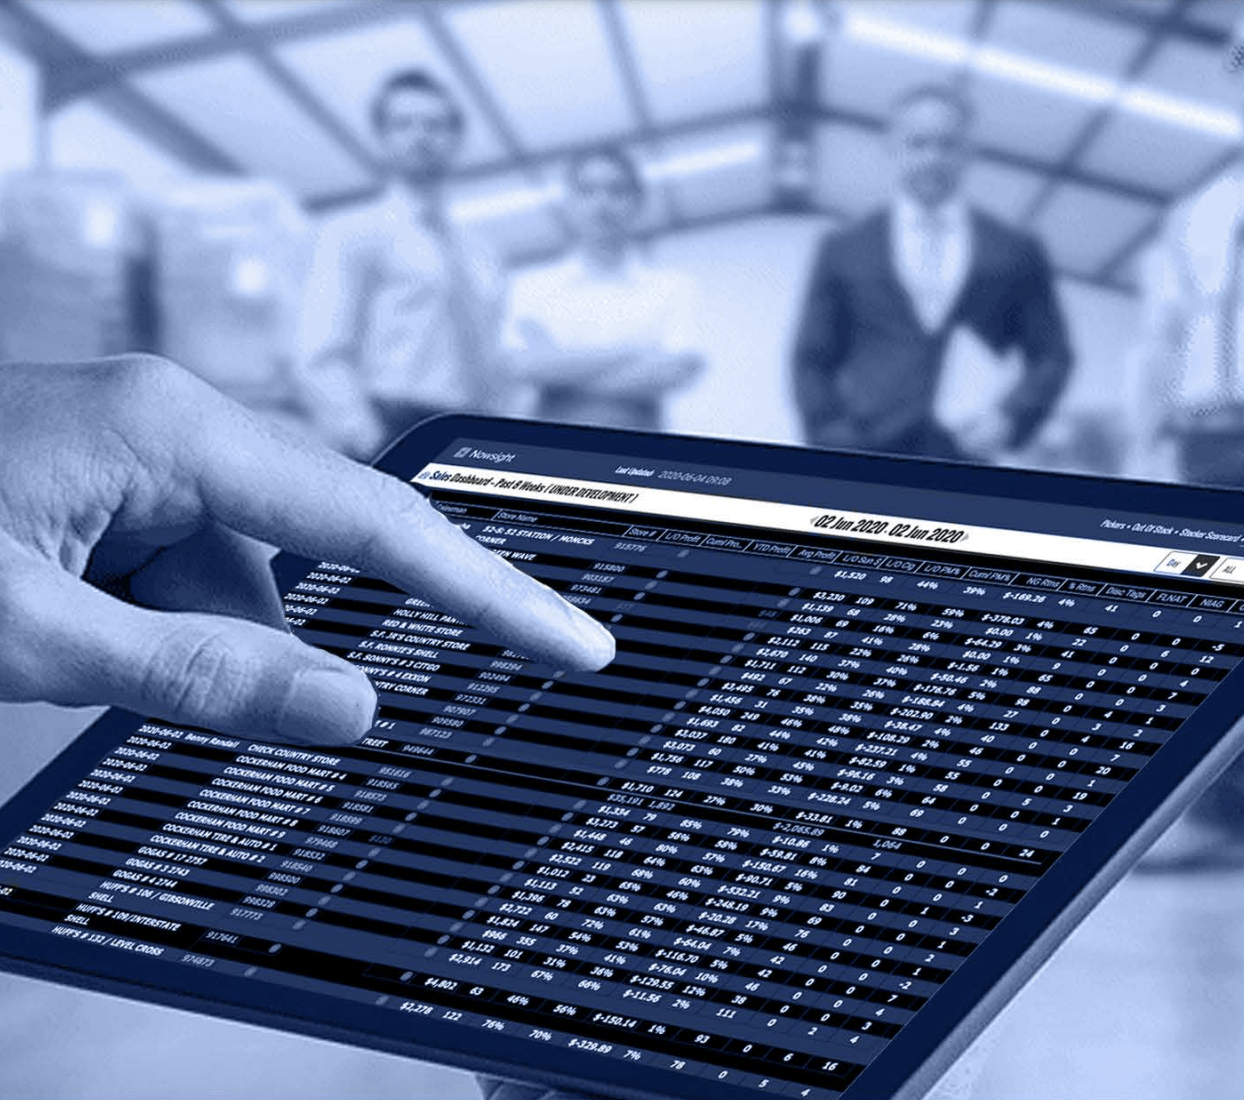
The Sales Dashboard is configured to show exactly the information your sales team needs to see. Here is an example of the information one distributor uses to track sales. This includes Last Order (L/O) Profit along with Last Order specifics — tracking categories of goods that are being ordered so they can spot trends and offer ordering incentives. It also tracks returns in dollars and percents — making it easy to spot outliers and maintain predictable revenue.

Share the right data to motivate employees.
Employees love knowing how they are performing relative to their goals and each other. The Nowsight Sales Dashboard shows, at a glance, how each account is being managed by order, by SKU, and over time. By empowering front-line employees to know exactly which product categories generate the most margin — Nowsight clients typically see a 35% increase in high-value product sales.
The Sales Dashboard is available 24/7/365 online and delivered every morning via email.
And because the Dashboard is connected to your sales and inventory system in real-time, the data is always up-to-the minute and readily available.
The sales dashboard is easily configured for any business — whether you see goods, deliver services, maintain inventory or do custom production. Time and again we see that informed sales teams become high-performance sales teams.
Never run another sales report—it’s really that simple.