The case for real-time alerts and escalations: when management dashboards aren’t enough

Pharmaceutical-related case study

At-a-Glance
The Impact of Business Intelligence
  • Line speed increased up to 80-100%
  • Changeover time reduce by at least 80%
  • Downtime reduced by up to 93%
  • First-time quality improved from 88% to 99.8%

BOTTOM-LINE IMPACTS OF POOR PRODUCTIVITY

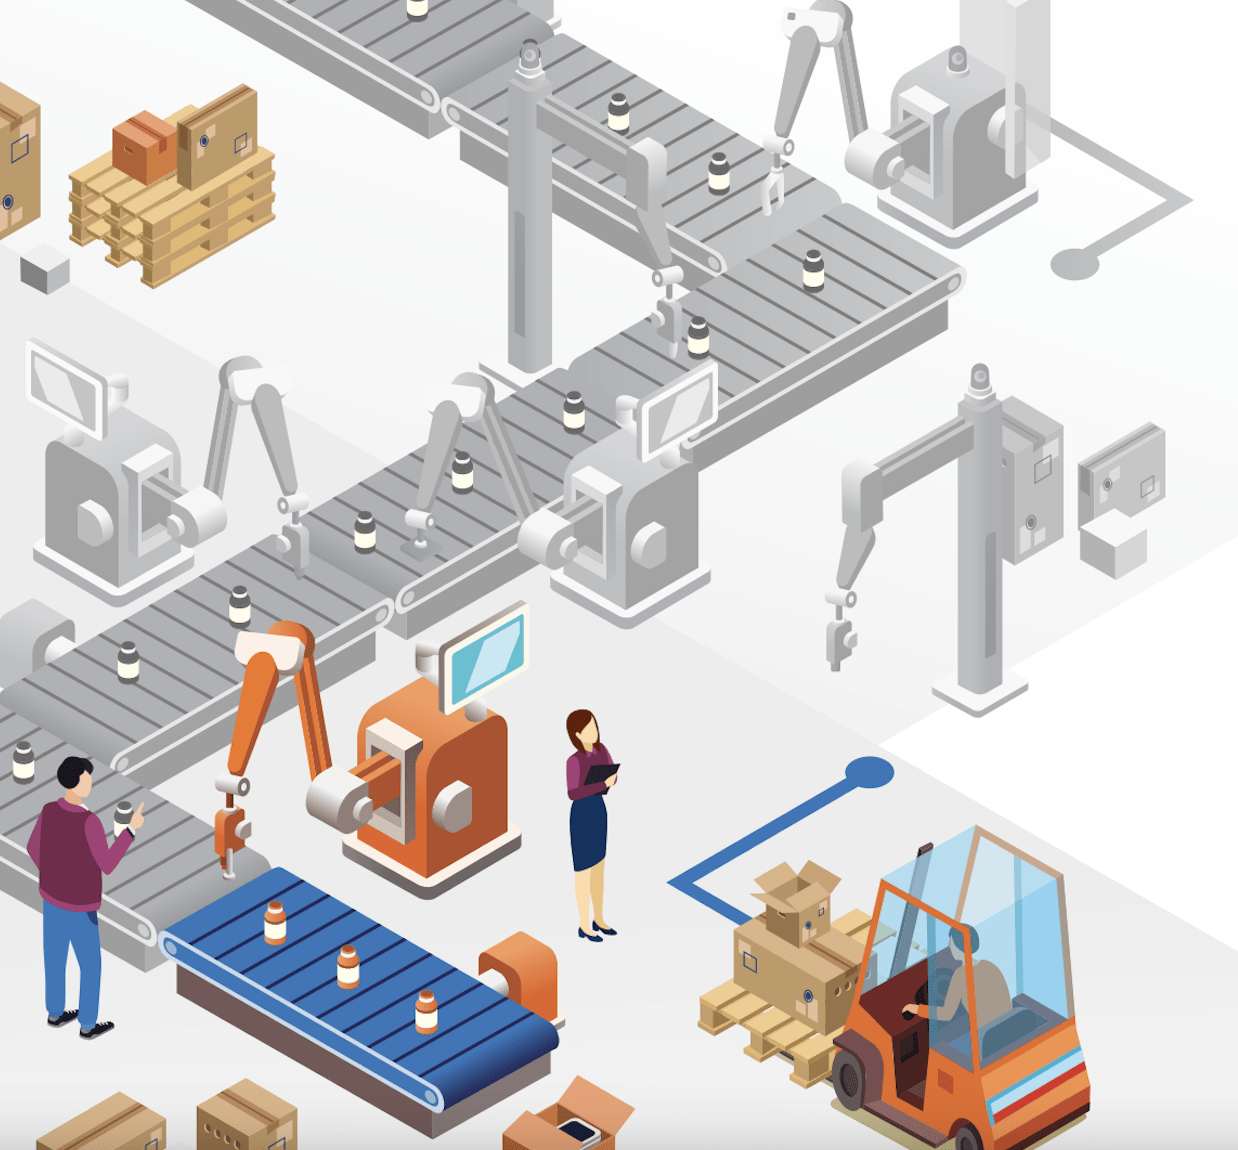
A pharmaceutical-related manufacturing business was plagued with heavy downtime and poor productivity. Downtime was extremely expensive for this operation. Manufacturing lines, when operating properly, produced at most 100 units per minute at an average sale price of up to up to $20 per unit.

Generally, downtime was related to a variety of factors including: preventive maintenance, spare part inventory, changeovers. However, there was a heavy human component embedded in all these issues, as well. Production workers and front-line supervisors, genuinely wanting to be resourceful and helpful, were attempting to solve production line problems on their own, without escalation. These well-intentioned employees lacked the resources to properly fix many of the root cause issues and it created a self-feeding system of repeated breakdowns and repairs. Root-cause analysis was rarely done due to lack of information and the urgency to get the line running, and the fixes were never documented or shared with management.

The traditional manufacturing summary report told management the next morning total downtime and high-level information in a spreadsheet format. It would provide basic output, quality, and uptime information but without the granularity and insights required to understand the deeper issues; it was almost impossible to prevent many of the issues plaguing the operation in the future.


  • Were downtime events all related or unrelated?
  • Were they due to part malfunctions, operator error, configurations being changed, or some combination of everything?
  • Was the problem likely to recur?
  • Did the shift manager or operations leader know about the issues?

Unable to answer any of those questions, and struggling with business-impacting productivity issues, the business made a dramatic change to radically improve their business intelligence, ensuring they got the information they needed, when they needed it, in a way they could take action—with the goal of improving their bottom line.

IMPLEMENTING REAL-TIME ALERTS AND ESCALATION SYSTEMS

The first steps in creating the necessary signaling and escalation process was to ensure all the necessary data feeds were connected, and to document the correct escalation protocols.

Existing protocol was to escalate any downtime issue when an incident >20 minutes occurred. But people got busy fixing problems or sometimes they forgot, and the next thing they knew, an incident had ballooned to 4-5 hour. All while not getting the support they needed to truly solve the problem with the right resources or necessary capital.

The next morning, their traditional manufacturing summary report told management total downtime and high-level information, but it lacked actionable information and it was almost impossible to prevent many of the issues plaguing the operation from recurring.

The manual escalation system was then automated:


  • After 5 minutes of downtime, the shift supervisor was notified via text
  • After 10 minutes of downtime the operations manager was notified via text/email
  • After 20 minutes of downtime, the COO was alerted

These downtime and output alerts were accompanied by requests for information, so accountability was also driven in real-time. If an incident’s cause wasn’t logged, that was also escalated. By having the system alert the team to gaps in knowledge, it drove the organization to accountability and a common understanding of problems. This complete, single-source of truth also allowed for root-cause analysis, trend identification, and further productivity improvements.

RESULTS MEASURED IN DOLLARS AND HOURS

The impact of business intelligence on this pharmaceutical-related business cannot be understated.


  • Line speed increased 80-100% (from over 180 units per minute to 160-180 units/minute)
  • Changeover time reduced by up to 80%
  • Downtime incidents >3 min/shift dropped more than 80% (from 25-30 to less than 5)
  • Average downtime per incident dropped more than 65% (from 15-25 min to less than 8 min)
  • Productivity increased by 180% due to improved efficiency, fewer repairs, and increased line speed
  • First-time quality improved from 88% to 99.8%
  • Escalation to the next level was 100%

Downtime was reduced more than 80% after the implementation of real-time alerts and the supporting business processes. Line speeds went up. A facility that was struggling to deliver a price-competitive product to market turned into a highly profitable organization as productivity soared.

Now the dashboard shows actionable information on downtime. It shows root cause, time-to-resolution, frequency, and much more. And underpinning the dashboard are solid, trackable business processes that ensure the right information gets into the right hands, at the right time.

With increased uptime, people adjusted their time on the Spectrum of Impact from React/Fix to Improve/Prevent. Instead of a small problem being temporarily fixed 10 times in a shift, a correctly-done fix lasted permanently, in most cases.

Let's talk about how you can see similar (or better) results! Get a free data analysis in just 30 minutes. Schedule a demo!